Pace Report
Year on year comparison report for reservations, nights sold, ADR, occupancy and operational revenue in RMS.
The Pace report provides a year on year comparison for Reservations, Nights Sold, Average Daily Rate, Occupancy and Operational Revenue.
-
Information
-
Use
- Add Button
Information
The Pace report provides a year on year comparison for Reservations, Nights Sold, Average Daily Rate, Occupancy and Operational Revenue.
The Pace report can be used to track performance compared to previous years and develop or pace occupancy and revenue growth and revenue trends compared to previous operating periods with a graph for date ranges greater than one month.
The Pace report can be generated with a daily breakdown as a .csv export under 'More Options'.
Comparison options for the Pace report include Last Year, Year Before Last, Last Year & Year Before Last or No Comparison.
Using the available comparison options the Pace report can be used to compare the current year's (2021) performance to last year (2020), the year before last year (2019), a combination of both last year and the year before last (2019 & 2020), or no comparison.
The Group options can be used to breakdown performance and review variances at a granular level per Property, Property State, Category, Category Grouping or Day of the Week.
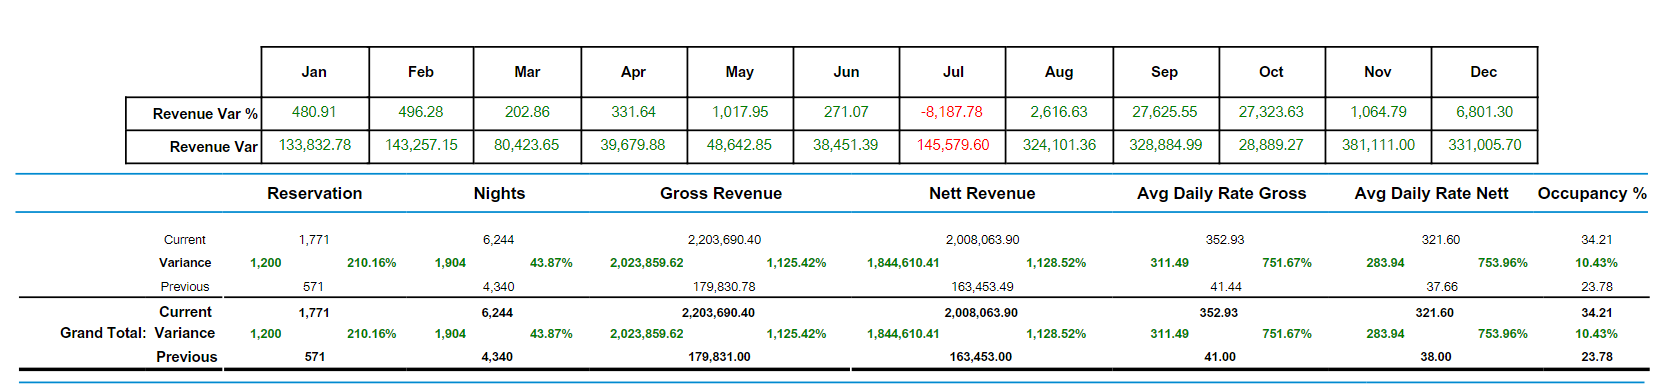
The variance between the current period and previous periods will be displayed as a whole value on the left and a percentage on the right of each data column.
The Pace report performance breakdown includes the following information.
| Report Column/Row | Description |
|---|---|
| Rows | |
| Current | Value for the current period selected as the 'For Reservations Between' date range in the build options. |
| Variance | The difference between the value for the current period and the previous period shown as a whole value on the left and a percentage on the right of the column. |
| Previous | Value for the previous period selected as the 'Compare To' in the build options. |
| Previous 2 | Displayed when the 'Compare To' option is selected as 'Last Year & Year Before Last'. Using this option 'Previous' will be Last Year and Previous 2 will be the Year Before Last. |
| Columns | |
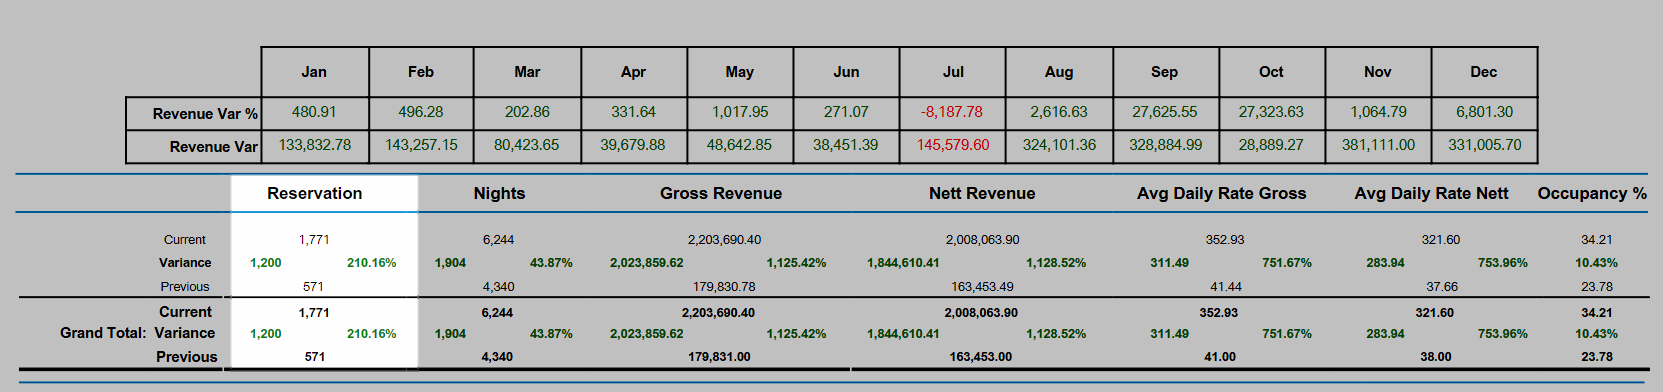
| Reservation | Total Reservations for the period. |
| Nights | Total Reservation Nights for the period. |
| Gross Revenue | Total Operational Revenue amount prior to any deductions of applicable taxes. Gross & Nett figures may display the same value under the following circumstances:
|
| Nett Revenue | Total Operational Revenue less any deductions for applicable taxes. Gross & Nett figures may display the same value under the following circumstances:
|
| Average Daily Rate Gross | The Total Gross Revenue divided by the Total Reservation Nights for the period. |
| Average Daily Rate Nett | The Total Nett Revenue divided by the Total Reservation Nights for the period. |
| Occupancy | The Total Reservation Nights as a percentage of the Total Available Reservation Nights for the period. |

Category, Area, Reservation, Guest, Rate & Tax are default System Labels that can be customised.

Users will require Security Profile access to view this report.
-
Use
- Add Button
Use
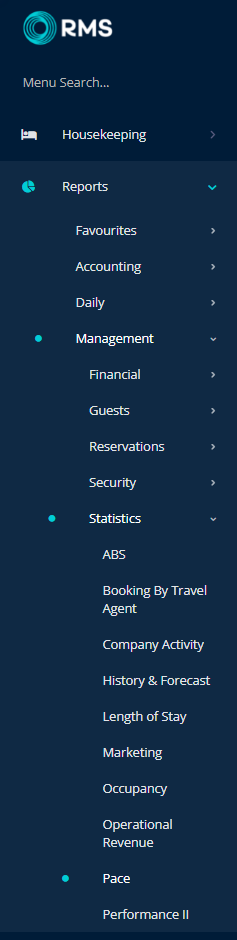
- Go to Reports > Management > Statistics > Pace in RMS.
- Select the 'Reservations Made Prior To' Date.
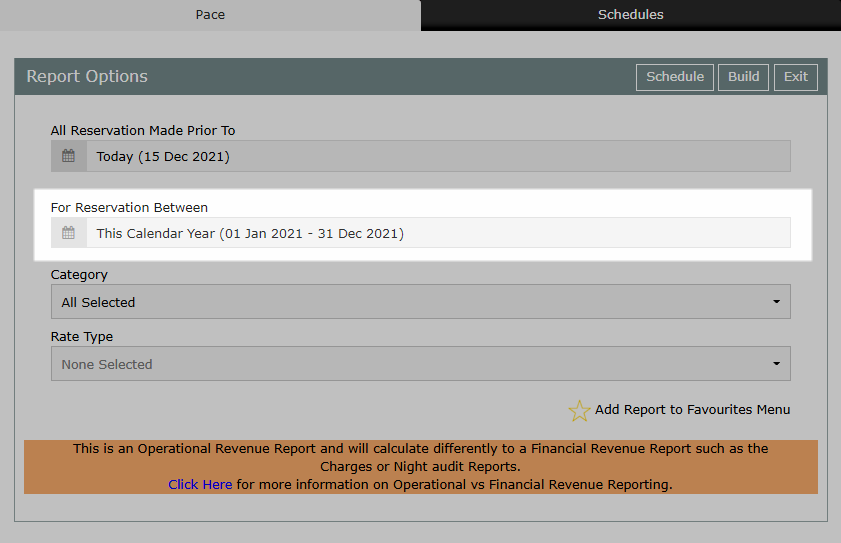
- Select the 'Reservations Between' Date Range.
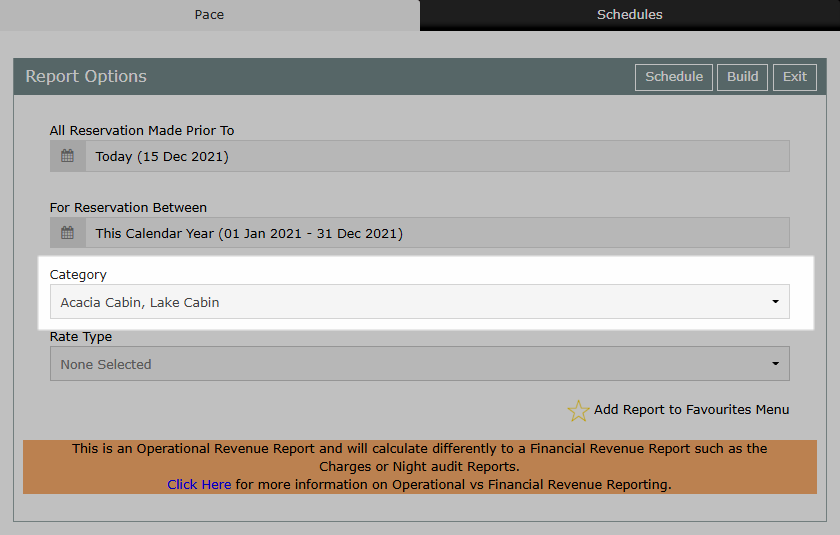
- Optional: Select a Category.
- Optional: Select a Rate Type.
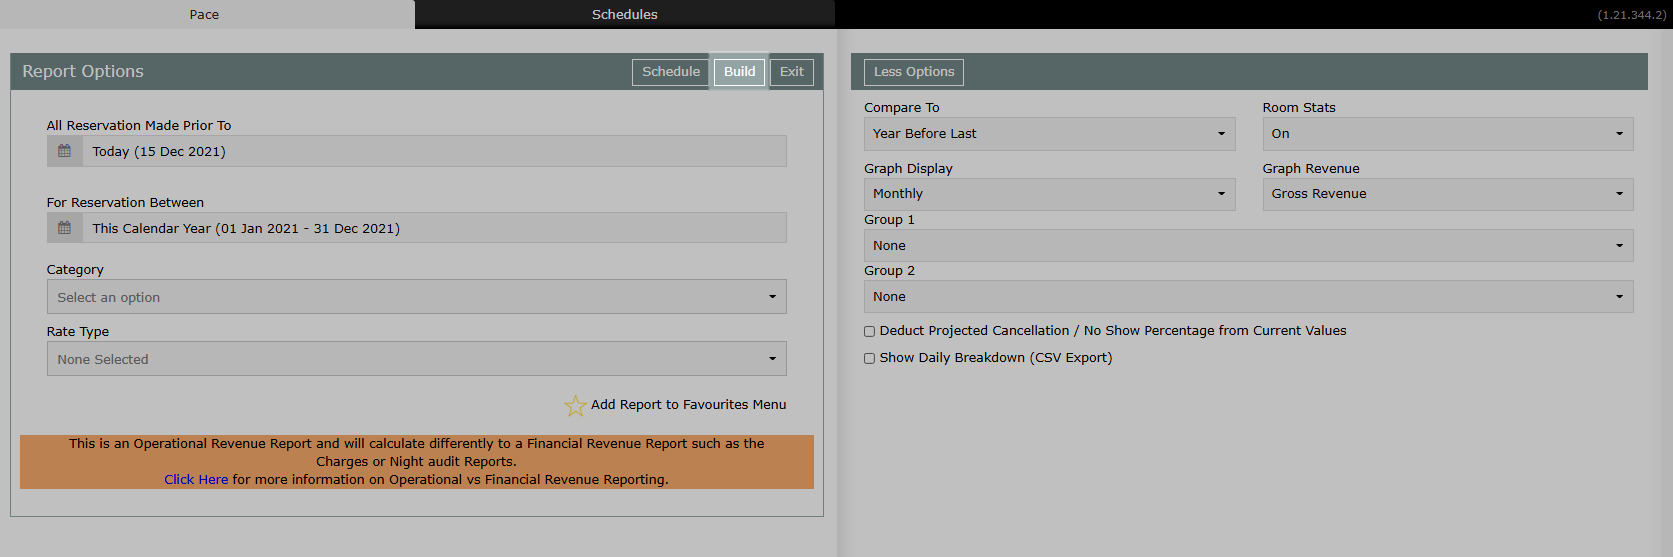
- Select 'More Options'.
- Select a 'Compare To' option.
- Select a 'Graph Revenue' option.
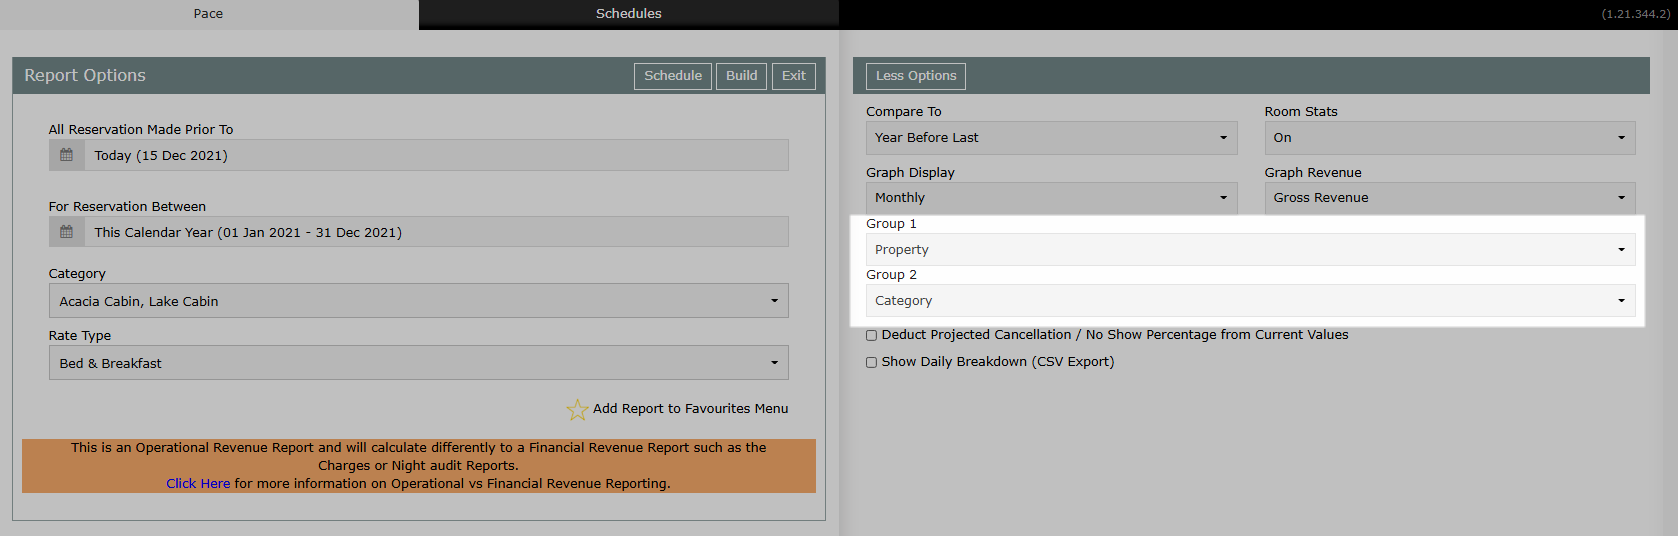
- Optional: Select 'Grouping 1 & 2'.
- Build.

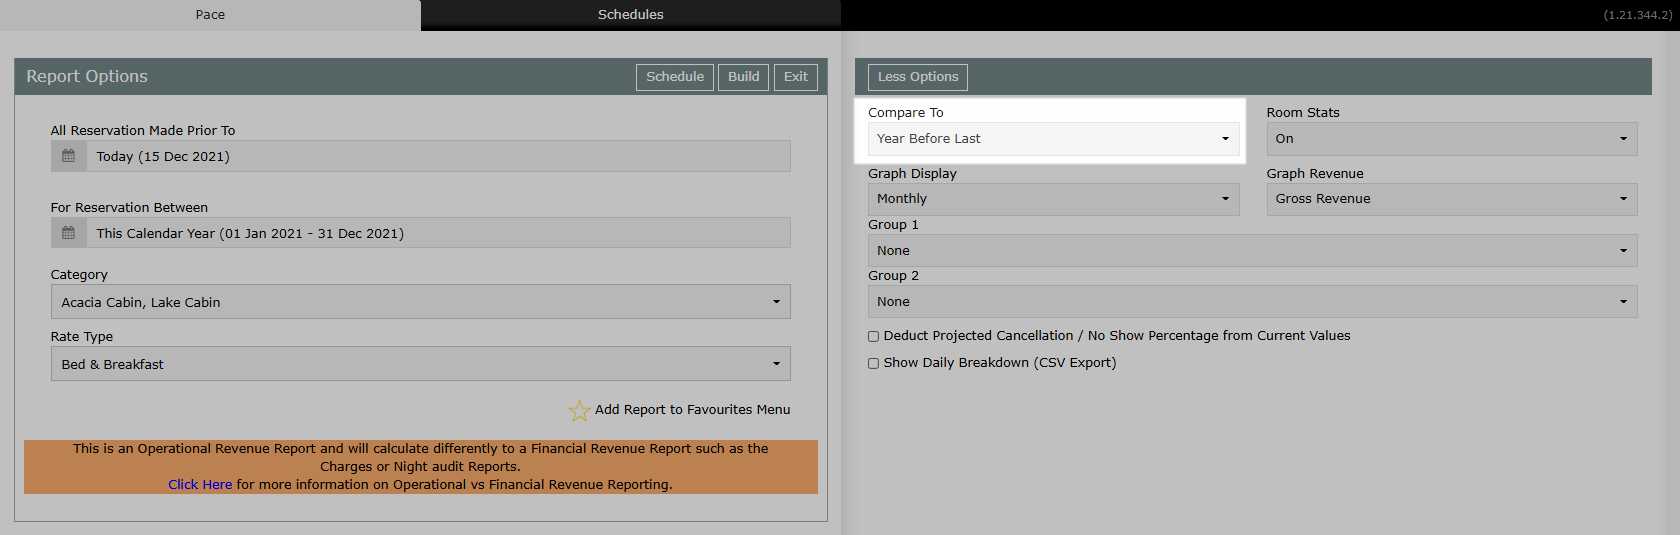
Comparison options for the Pace report include Last Year, Year Before Last, Last Year & Year Before Last or No Comparison.
The Group options can be used to breakdown performance and review variances at a granular level per Property, Property State, Category, Category Grouping or Day of the Week.
-
Guide
- Add Button
Guide
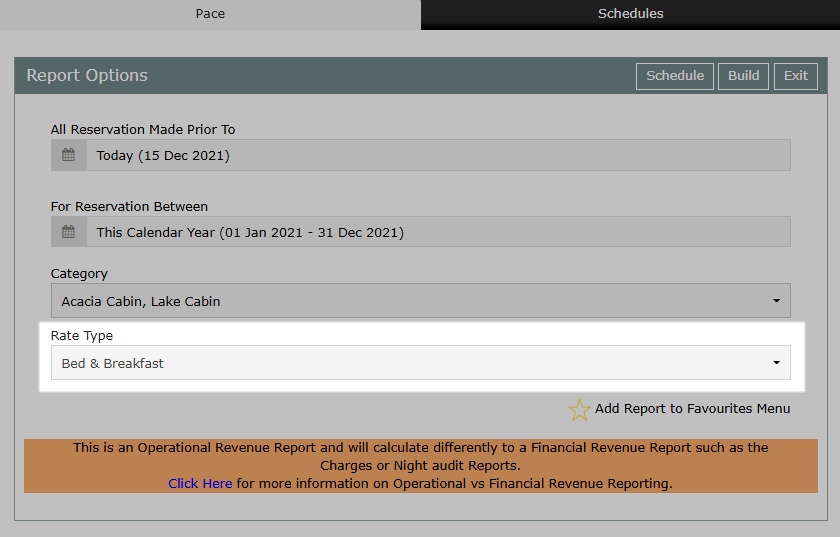
Go to Reports > Management > Statistics > Pace in RMS.
Select the 'Reservations Made Prior To' Date.
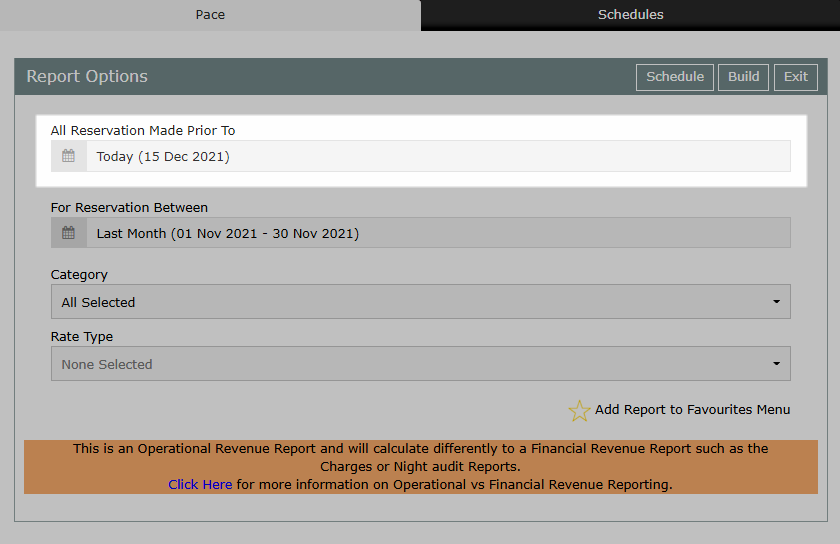
Select the 'Reservations Between' Date Range.
Optional: Select a Category.
Optional: Select a Rate Type.
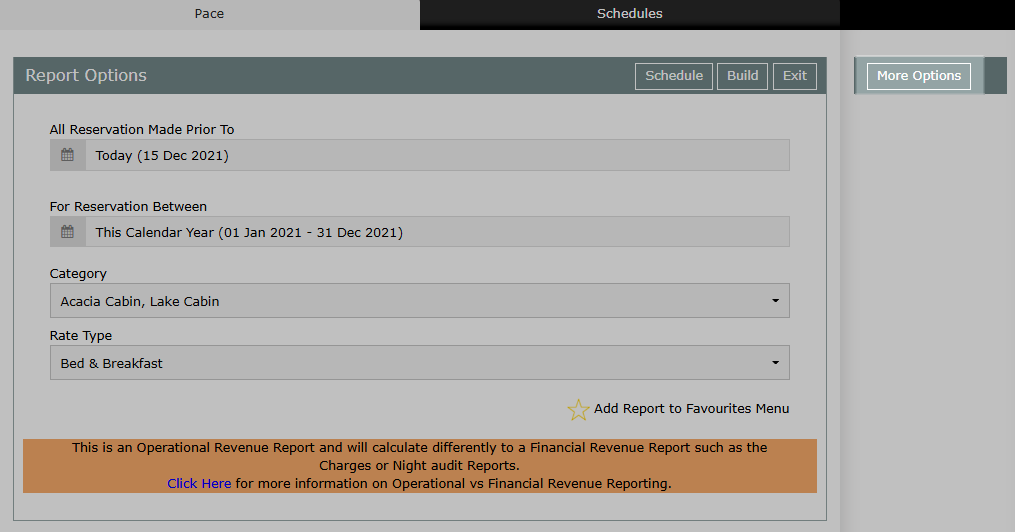
Select 'More Options'.
Select a 'Compare To' option.
Select a 'Graph Revenue' option.
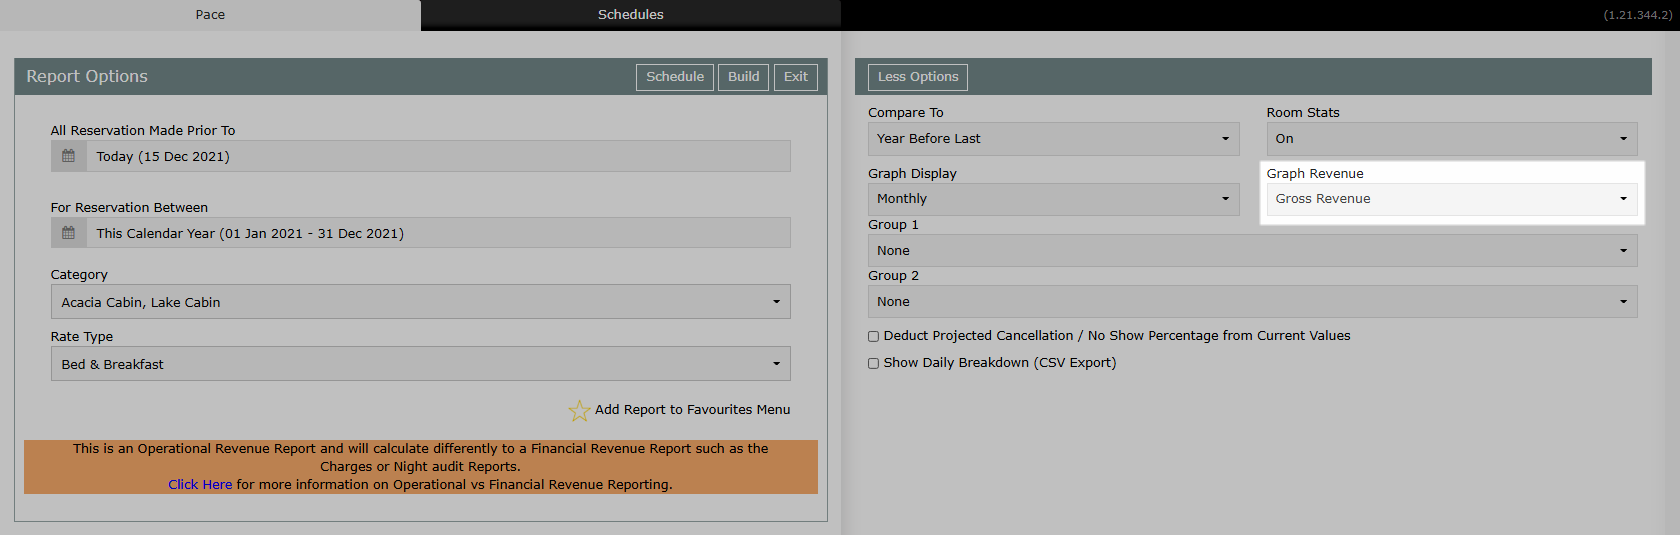
Optional: Select 'Grouping 1 & 2'.
Select 'Build' to generate the selected options.
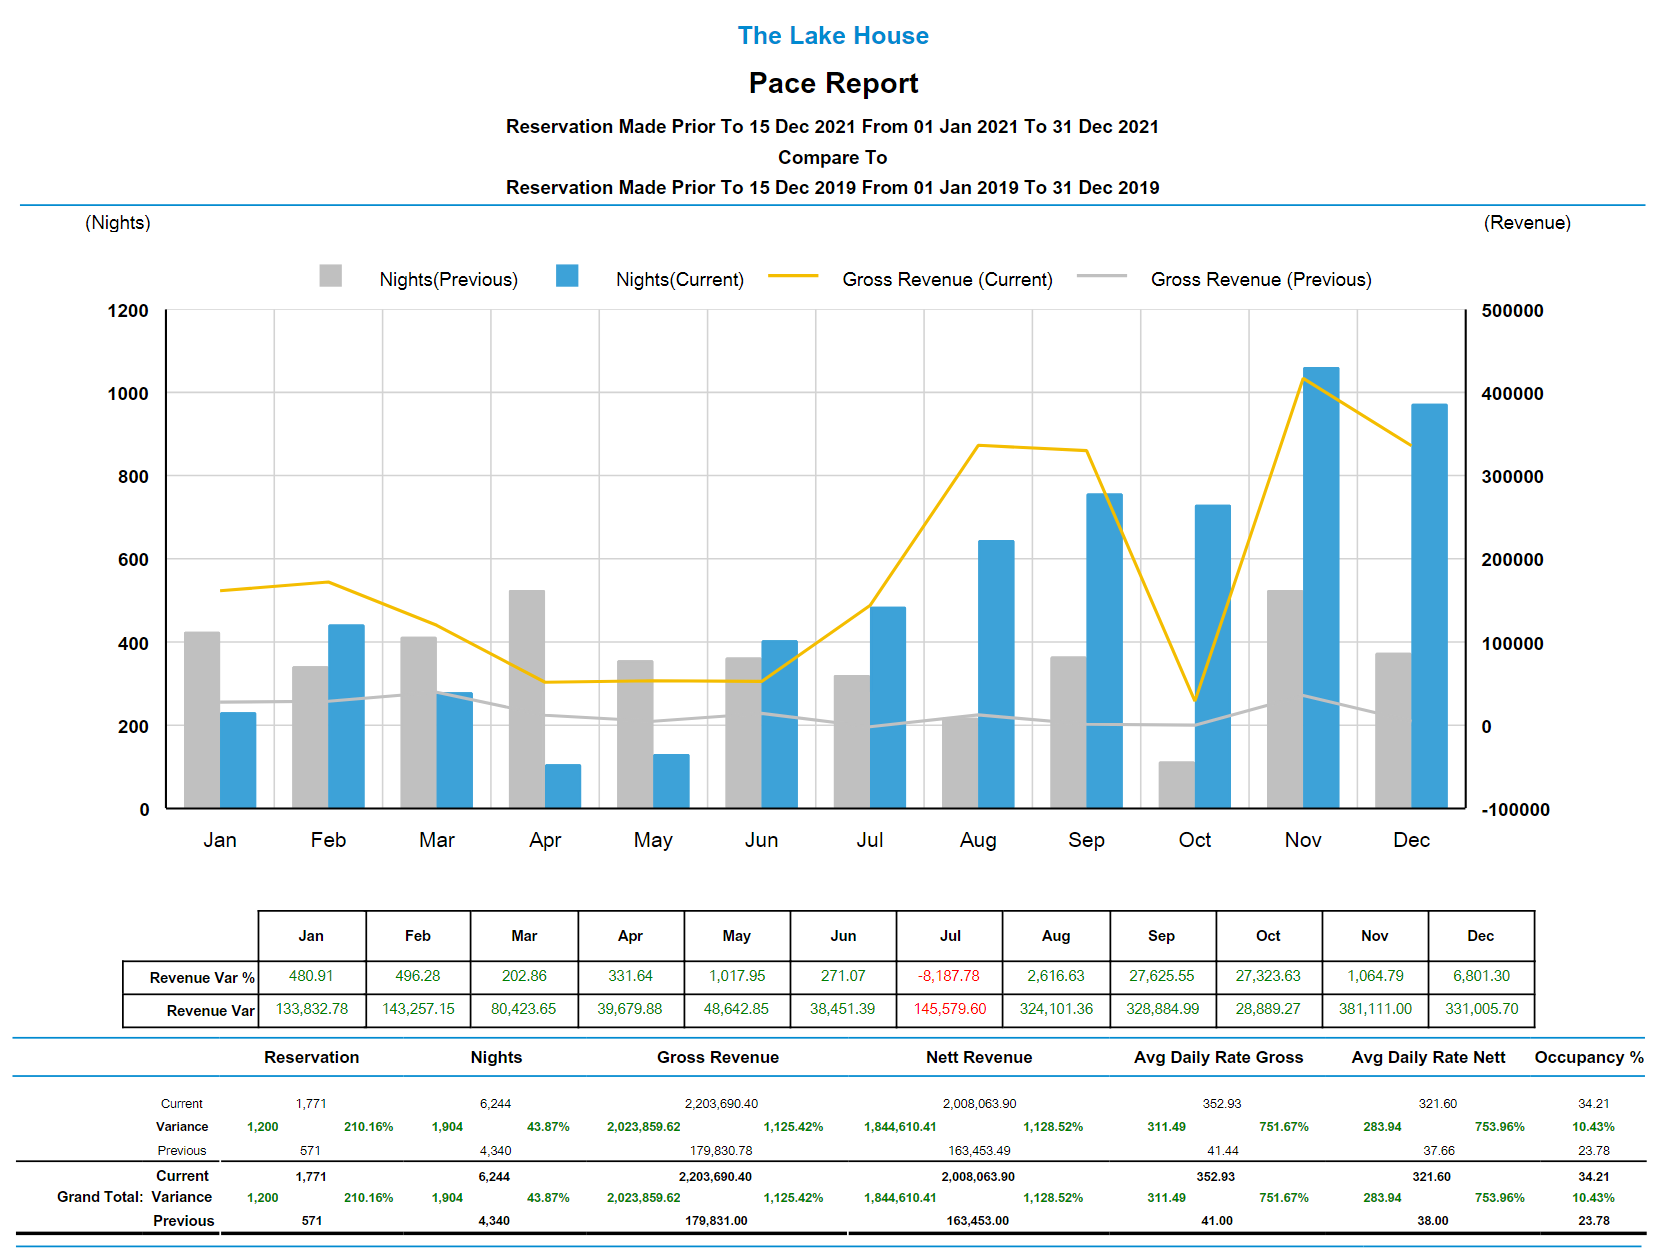
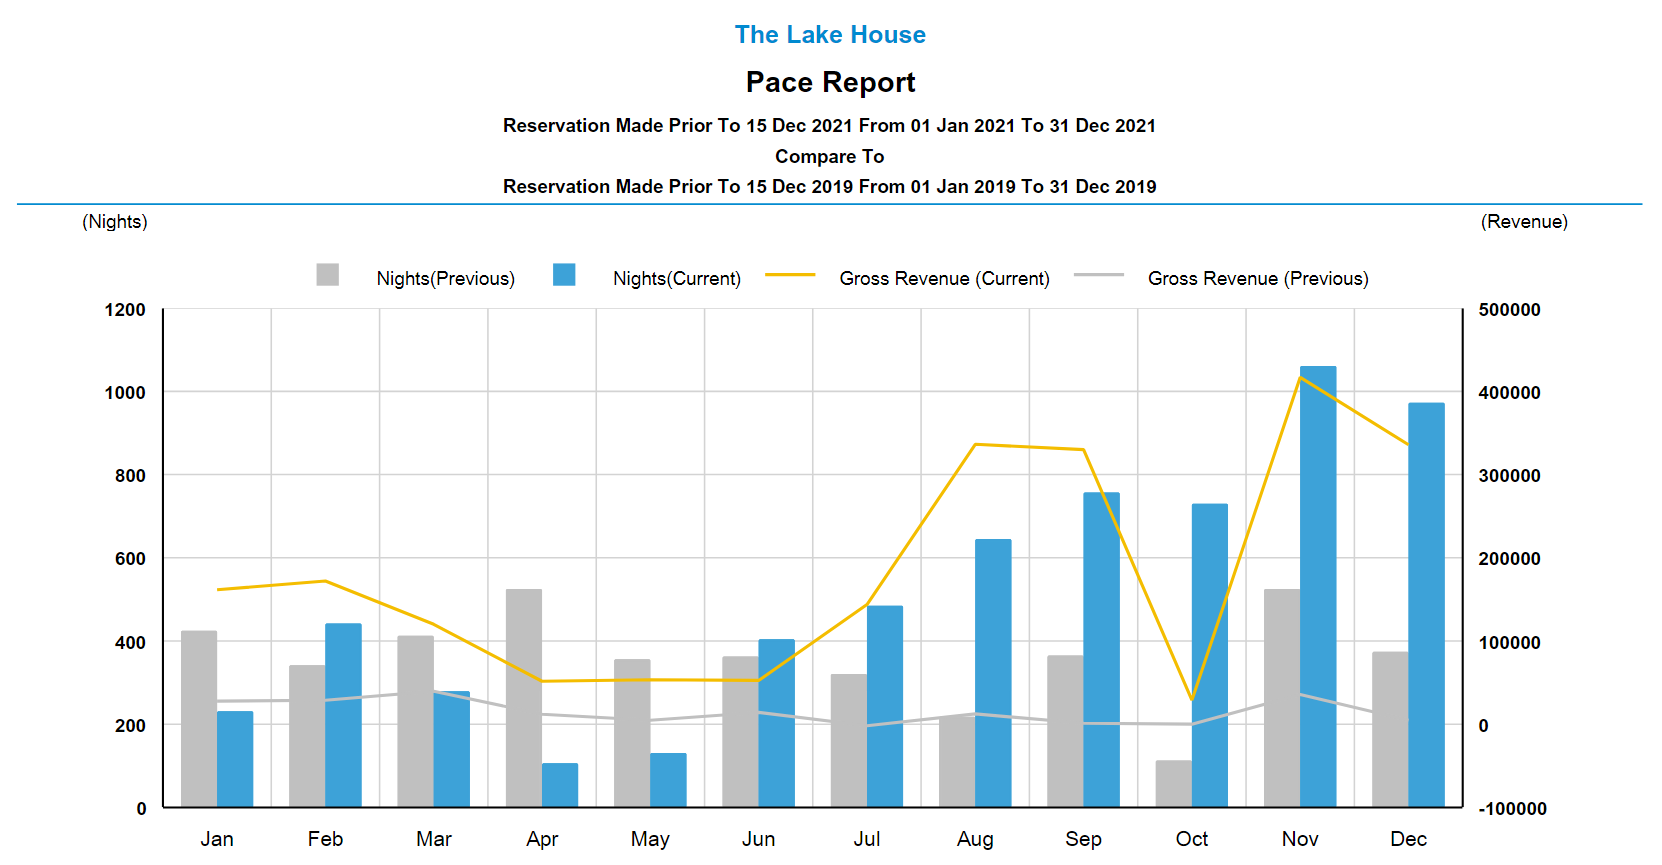
The Pace report will display the Total Reservations, Total Reservation Nights, Average Daily Rate, Operational Revenue and Occupancy percentage for the selected date range and includes variances between the current date selection and the selected comparison option.
Selecting the current date as the 'Reservation Made Prior To' date will provide an accurate performance overview of how the property is tracking as of today compared to the same time the previous period.

Use
- Go to Reports > Management > Statistics > Pace in RMS.
- Select the 'Reservations Made Prior To' Date.
- Select the 'Reservations Between' Date Range.
- Optional: Select a Category.
- Optional: Select a Rate Type.
- Select 'More Options'.
- Select a 'Compare To' option.
- Select a 'Graph Revenue' option.
- Optional: Select 'Grouping 1 & 2'.
- Build.
Comparison options for the Pace report include Last Year, Year Before Last, Last Year & Year Before Last or No Comparison.
The Group options can be used to breakdown performance and review variances at a granular level per Property, Property State, Category, Category Grouping or Day of the Week.
-
Guide
- Add Button
Guide
Go to Reports > Management > Statistics > Pace in RMS.
Select the 'Reservations Made Prior To' Date.
Select the 'Reservations Between' Date Range.
Optional: Select a Category.
Optional: Select a Rate Type.
Select 'More Options'.
Select a 'Compare To' option.
Select a 'Graph Revenue' option.
Optional: Select 'Grouping 1 & 2'.
Select 'Build' to generate the selected options.
The Pace report will display the Total Reservations, Total Reservation Nights, Average Daily Rate, Operational Revenue and Occupancy percentage for the selected date range and includes variances between the current date selection and the selected comparison option.
Selecting the current date as the 'Reservation Made Prior To' date will provide an accurate performance overview of how the property is tracking as of today compared to the same time the previous period.