Occupancy & Revenue Comparison Report
Report on Operational Revenue & statistics with year on year comparison in RMS.
-
Information
-
Use
- Add Button
Information
The Occupancy & Revenue Comparison Report can be viewed with a Monthly, Weekly or Category breakdown and grouped by Property or Travel Agent.
The Occupancy & Revenue Comparison report includes the following information:
| Report Column | Description | Additional Information |
|---|---|---|
| Period Nights | The number of nights included for the range displayed in this row. | When comparing two specific date sets the Period Nights will display as the number of nights within the specified date ranges. |
| Total Arrivals | The total number of reservations with an Arrival Date within this row's period of time. | This number does not include reservations that arrive before the start of the period and stay over, only new arrivals within the period. |
| Available Nights | The total number of nights available for sale within the period. | Available Nights is calculated by the total number of areas multiplied by the total number of Period Nights and is the maximum number of nights that could be sold for that date set. |
| Used Nights | The total number of reservation nights sold within the period. | Used Nights is calculated by the total number of booked nights within the period for the Total Arrivals. |
| Occupancy Percentage | The percentage of Available Nights Used within the period. | Calculated using the Available Nights and Nights Used. |
| Total Rate | The total Quoted Rate for all nights used within the period. | This figure does not include any sundries or alternative charges applied. |
| Average Lead Time | How far ahead of arrival the reservations were made within this period. | This number focuses on the reservations with the arrival date falling within this period only. |

The Total Rate will be reported including any applicable GST, VAT or Tax for Tax Inclusive properties and excluding taxes for Tax Exclusive properties.

Users will require Security Profile access to view this report.
-
Use
- Add Button
Use
- Go to Reports > Management > Financial > Occupancy & Revenue Comparison in RMS.
- Optional: Select a Category Grouping.
- Select the Categories.
- Select a Date Option.
- Select a Date Range.
-
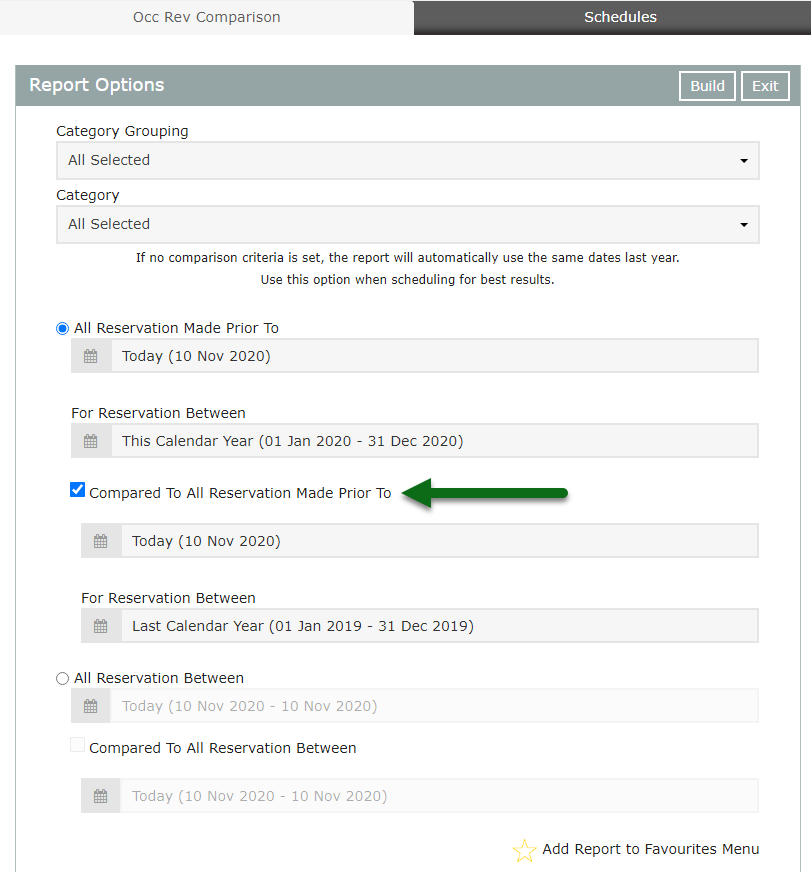
Optional: Select the Comparison Checkbox.
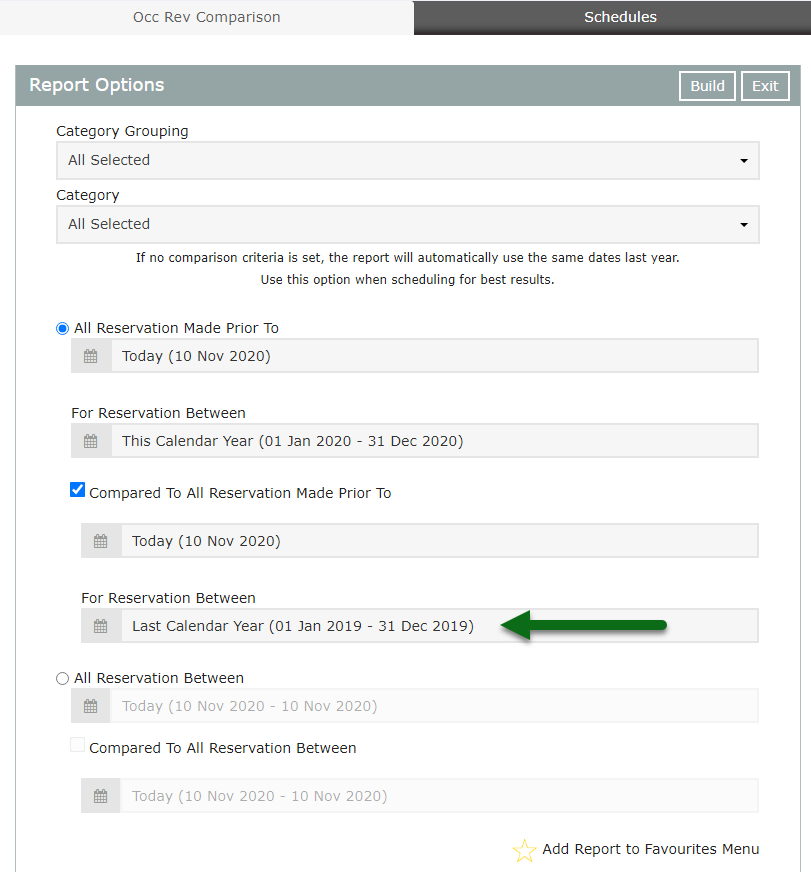
- Select the Comparison Date Range.
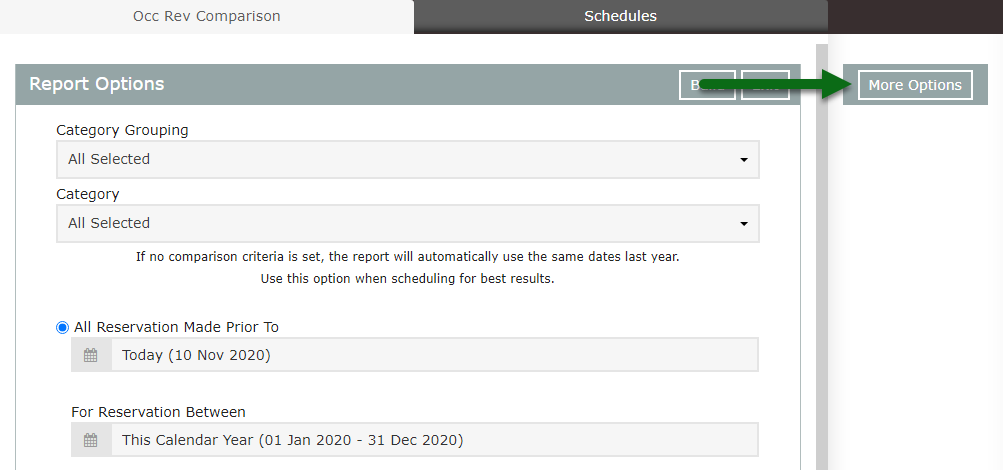
- Select 'More Options'.
- Optional: Select the View By option.
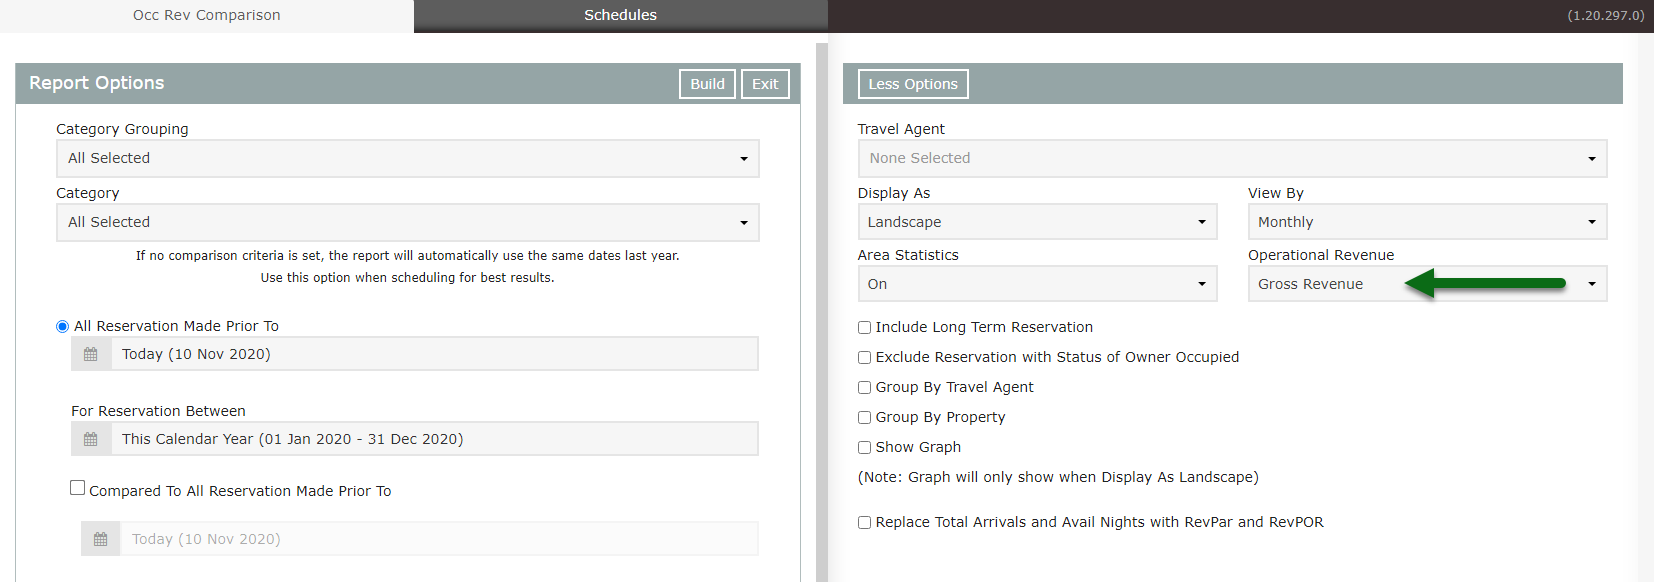
- Select the Operational Revenue option.
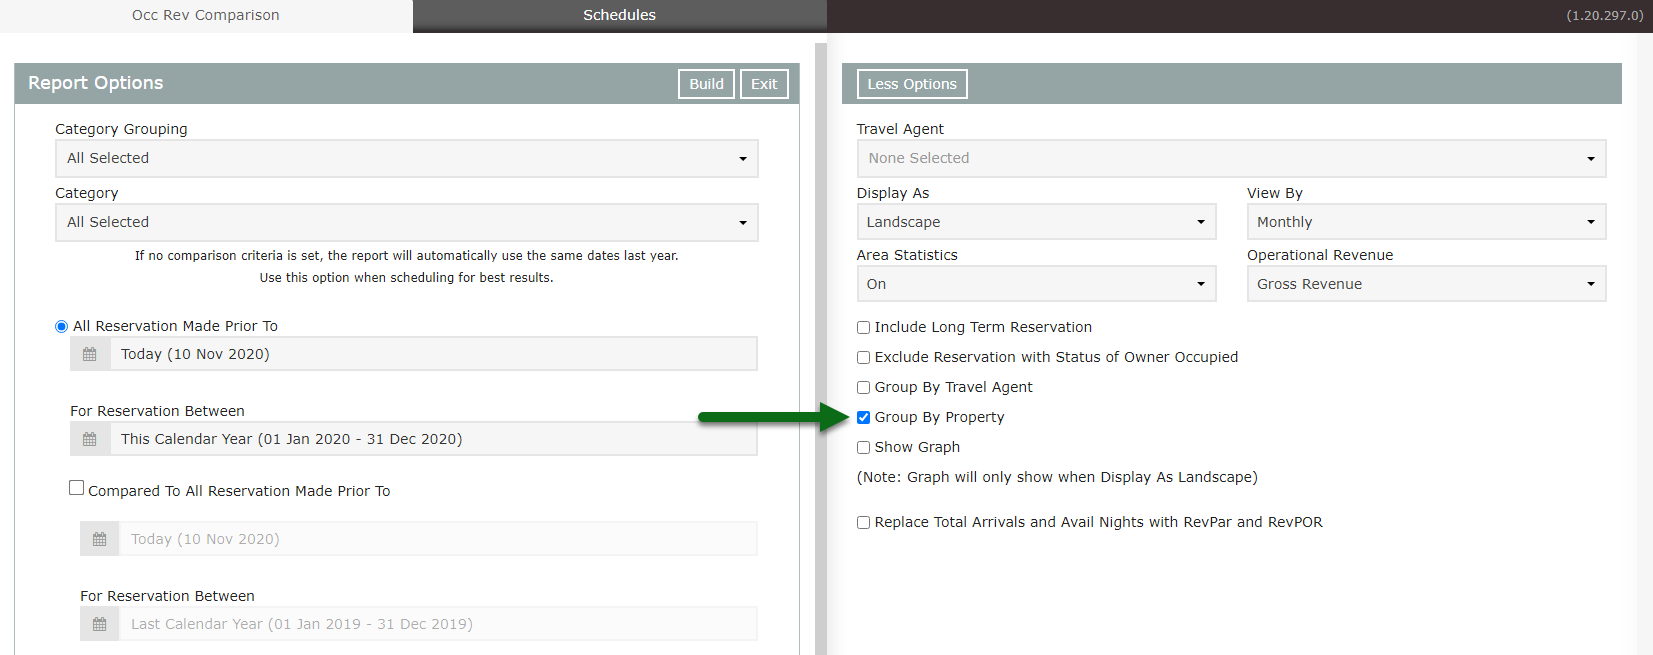
- Optional: Select the checkbox 'Group by Property'.
- Build.

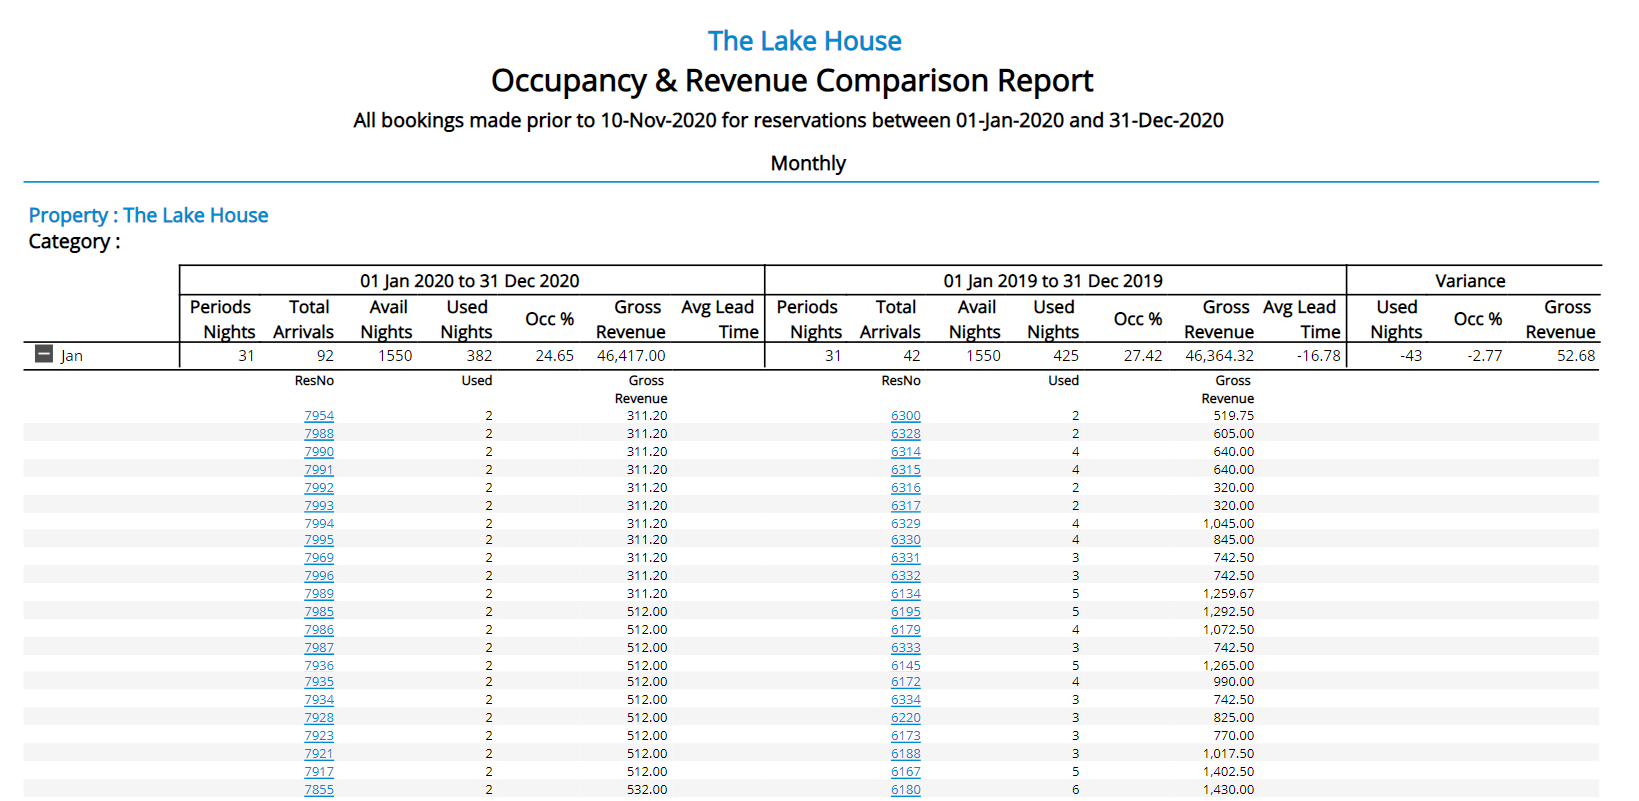
Select the  icon when viewing the report to expand sections and display more information on the individual reservations contributing to the reported figures. Use the
  icon to collapse the expanded section.
Select any reservation number in the expanded report section to go to that reservation in a new tab.

Interactivity is not available on the printed report.
-
Guide
- Add Button
Guide
Go to Reports > Management > Financial > Occupancy & Revenue Comparison in RMS.

Optional: Select a Category Grouping.
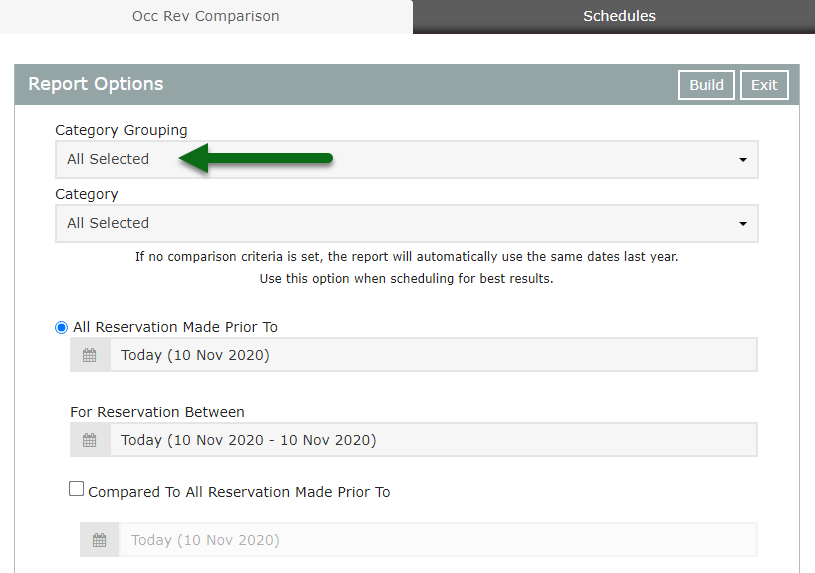
Select the Categories.
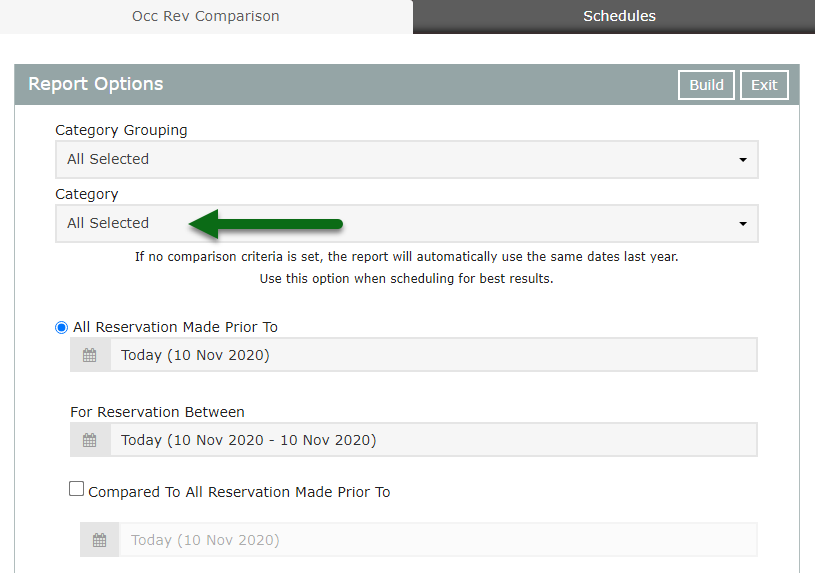
Select a Date Option.
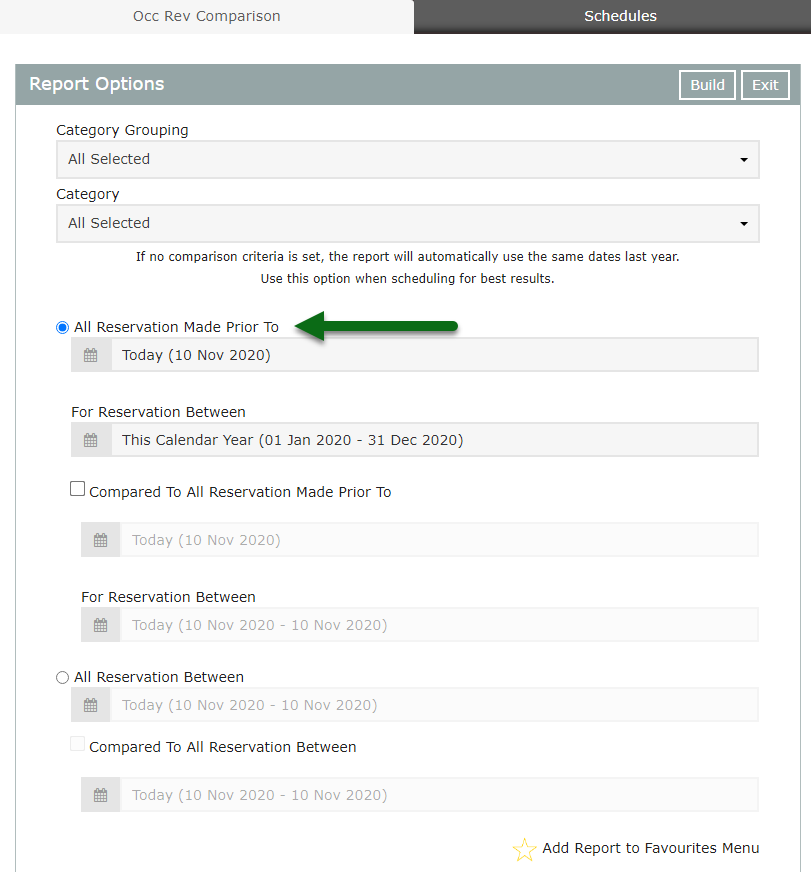
Select a Date Range.
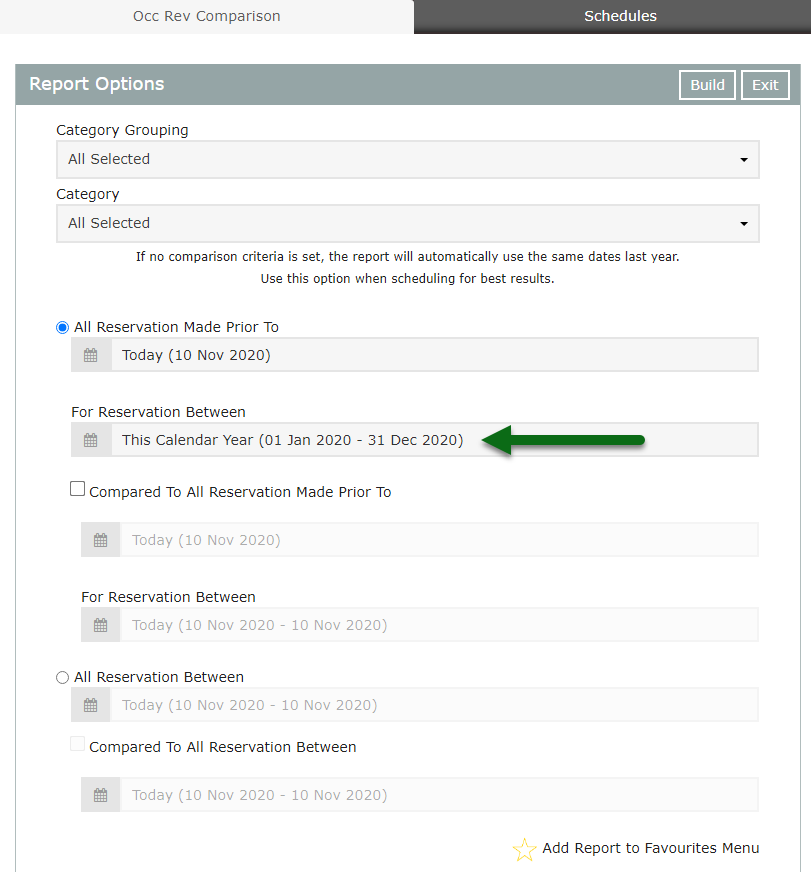
Optional: Select the Comparison Checkbox.
Select the Comparison Date Range.
Select 'More Options'.
Optional: Select the View By option.

Select the Operational Revenue option.
Optional: Select the checkbox 'Group by Property'.
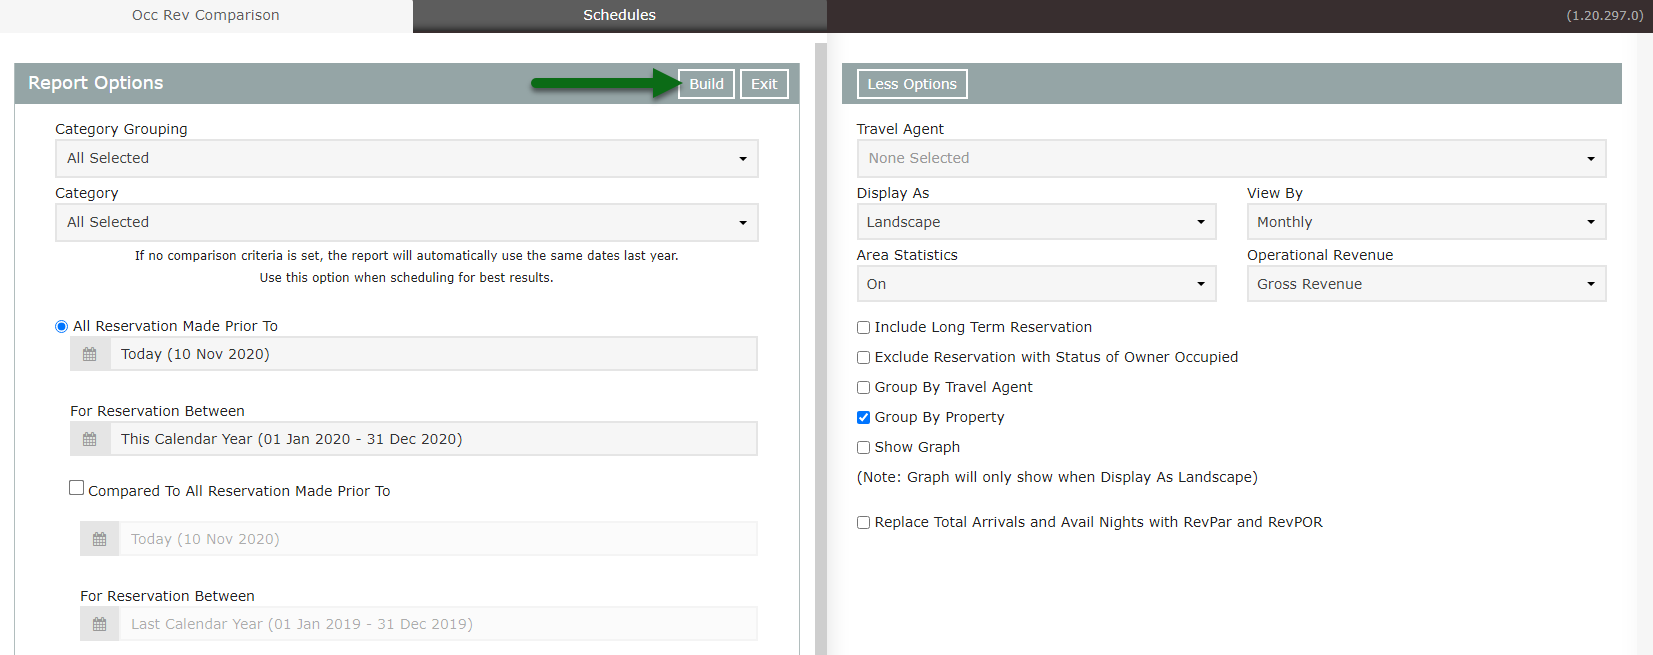
Select 'Build' to generate the report using the selected options.
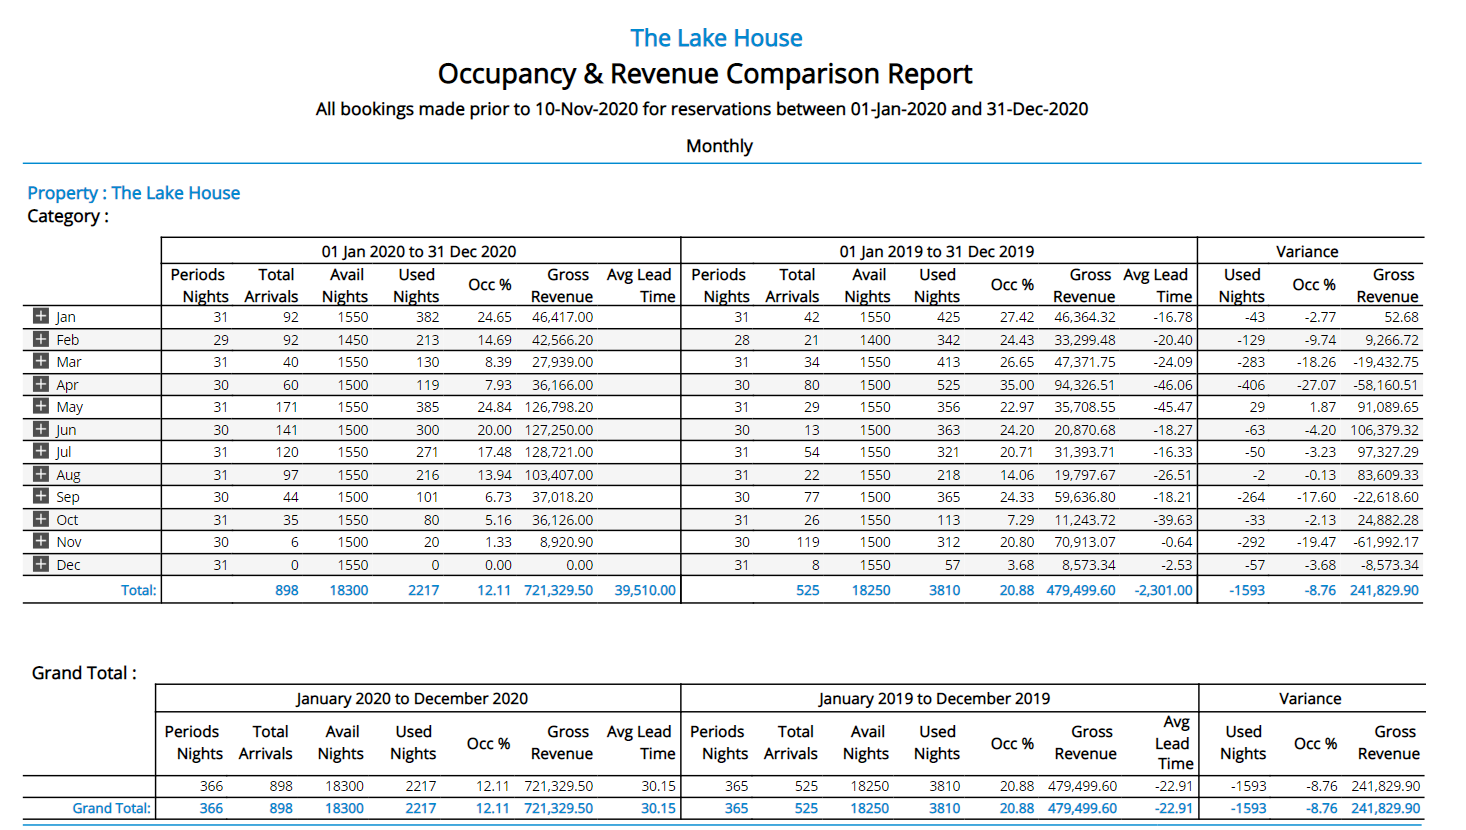
The Operational Revenue & Comparison Report will display a monthly breakdown of statistics and Operational Revenue for the selected date range with comparison to the same dates last year if no alternate comparison dates are set.
Use
- Go to Reports > Management > Financial > Occupancy & Revenue Comparison in RMS.
- Optional: Select a Category Grouping.
- Select the Categories.
- Select a Date Option.
- Select a Date Range.
-
Optional: Select the Comparison Checkbox.
- Select the Comparison Date Range.
- Select 'More Options'.
- Optional: Select the View By option.
- Select the Operational Revenue option.
- Optional: Select the checkbox 'Group by Property'.
- Build.

Select the  icon when viewing the report to expand sections and display more information on the individual reservations contributing to the reported figures. Use the
  icon to collapse the expanded section.
Select any reservation number in the expanded report section to go to that reservation in a new tab.

Interactivity is not available on the printed report.
-
Guide
- Add Button
Guide
Go to Reports > Management > Financial > Occupancy & Revenue Comparison in RMS.

Optional: Select a Category Grouping.

Select the Categories.

Select a Date Option.

Select a Date Range.

Optional: Select the Comparison Checkbox.

Select the Comparison Date Range.

Select 'More Options'.

Optional: Select the View By option.

Select the Operational Revenue option.

Optional: Select the checkbox 'Group by Property'.

Select 'Build' to generate the report using the selected options.

The Operational Revenue & Comparison Report will display a monthly breakdown of statistics and Operational Revenue for the selected date range with comparison to the same dates last year if no alternate comparison dates are set.

