NPS Results Report
Overview of the Net Promoter Score (NPS) and returned NPS Surveys in RMS.
The NPS Results Report is an interactive report that provides an overview of the Net Promoter Score (NPS) and returned NPS Surveys for the selected date range.
-
Information
-
Use
- Add Button
Information
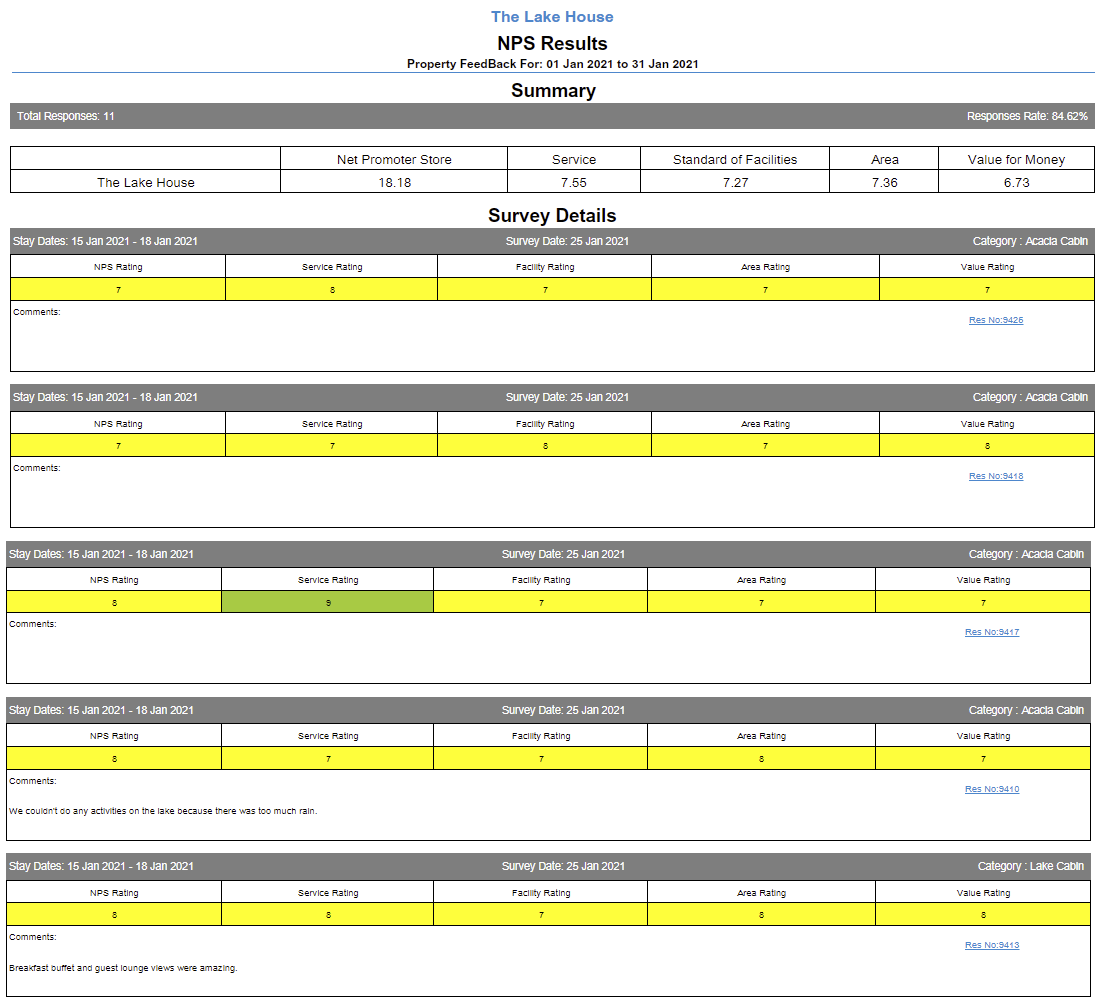
The NPS Results Report provides an overview of the Net Promoter Score (NPS) and returned NPS Surveys for the selected date range.
The NPS Results Report displays the selected property's overall NPS and ratings for each key metric included on the NPS Survey.
The report will display the total responses recieved and the response rate for surveys sent from RMS for the date range in addition to the individual survey results.

Select any reservation number in the report section to go to that reservation in a new tab.
Interactivity is not available on the printed report.
Use Scheduled Reports to automate delivery of the NPS Survey Results.

Users will require Security Profile access to view this report.

Promoters score a 9 or 10 and are loyal enthusiasts who will return to your property and refer your business to others. Scores in this range are shown in green on the NPS Results Report.
Passives score a 7 or 8 and are satisfied but unenthusiastic customers with potential to be attracted by competitors. Scores in this range are shown in yellow on the NPS Results Report.
Detractors score between 0-6 and are unhappy customers who could be damaging to brand or reputation with negative word of mouth, social media or review websites etc. Scores in this range will be highlighted red on the NPS Results Report.
The NPS Score is calculated as: Number of Promoters - Number of Detractors ÷ Completed Surveys x 100
Scores of 9-10 are considered excellent, 7-8 are good with areas for improvement and 0-6 indicates room for improvement.
The exception to this is the Value for Money score. High scores of 9-10 on Value for Money may indicate that pricing is set too low for the Category's services and facilities provided. Lower Value for Money scores may indicate that guests consider the price too high for the Category's services and facilities.
-
Use
- Add Button
Use
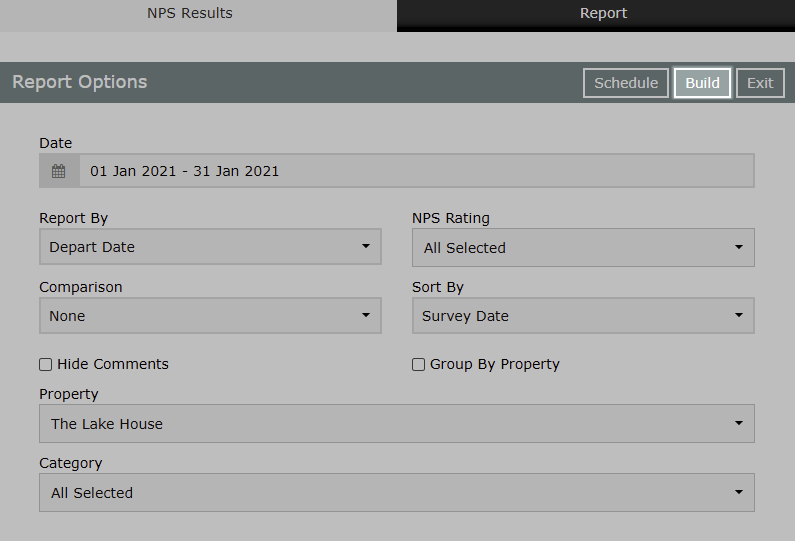
- Go to Reports > Management > Guests > NPS Results in RMS.
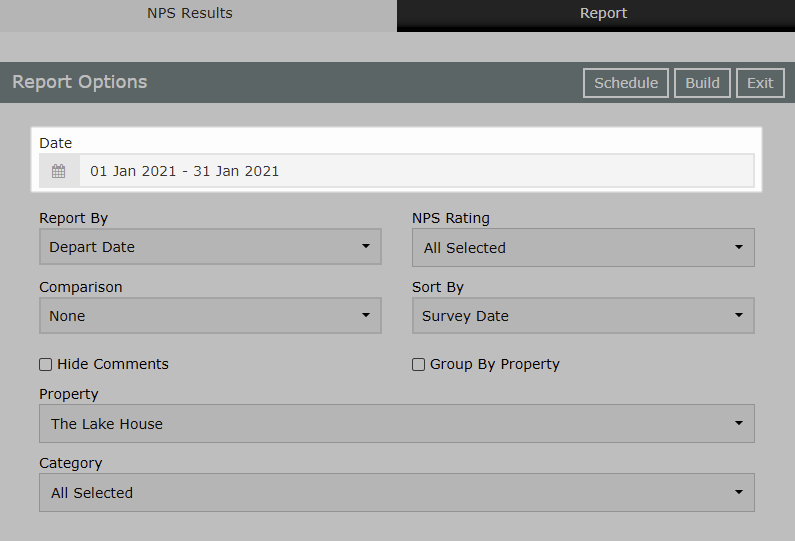
- Select the Date Range.
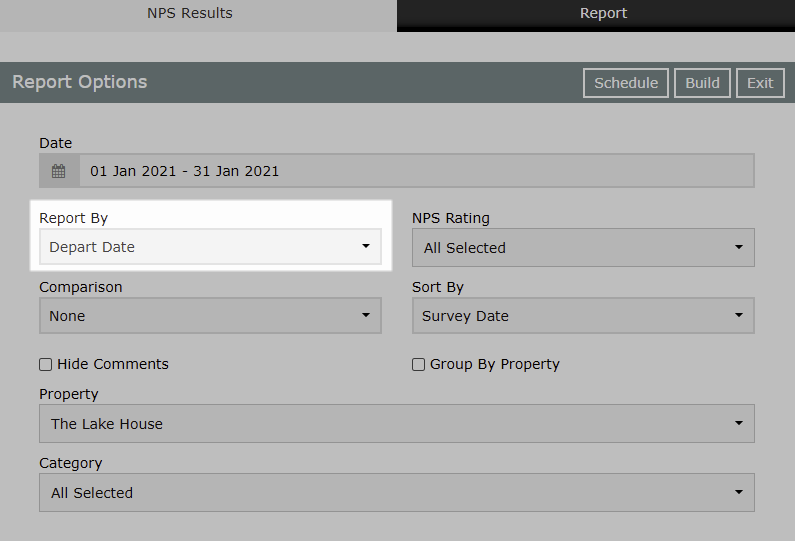
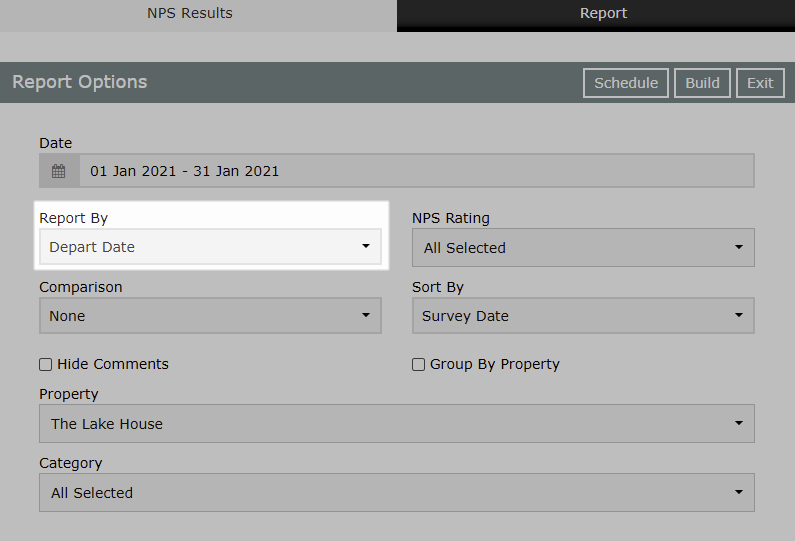
- Select the Report By.
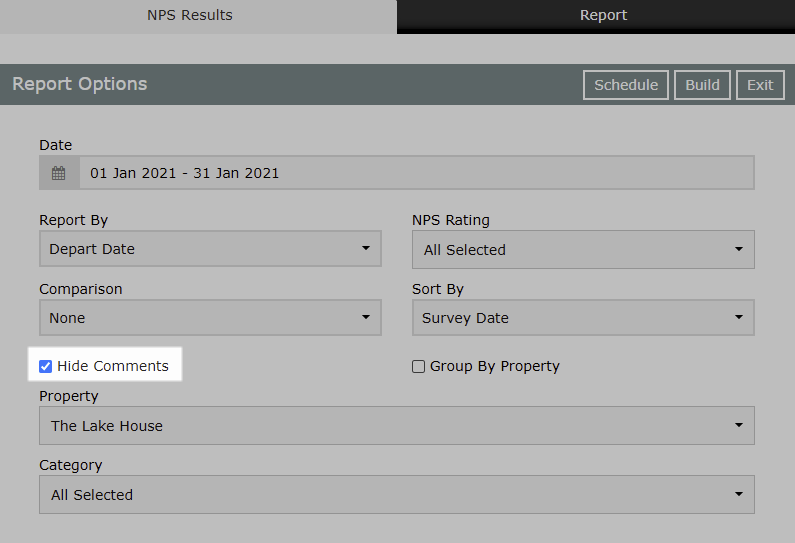
- Optional: Select the checkbox 'Hide Comments'.
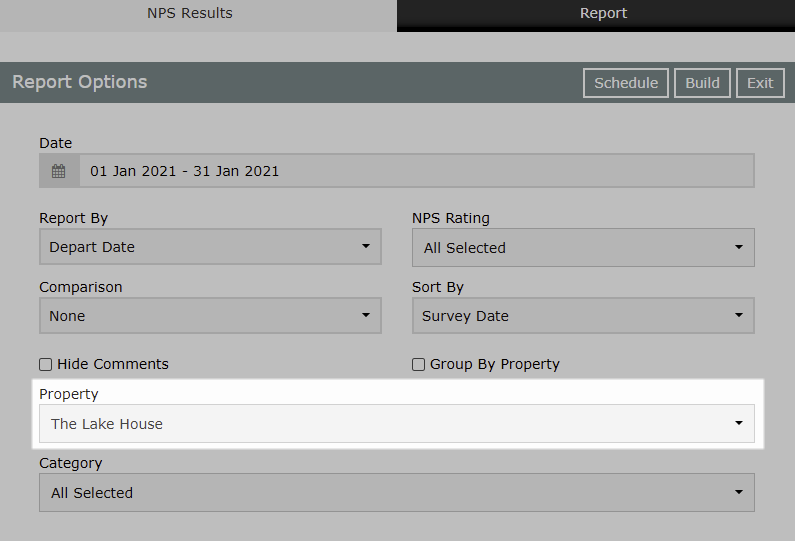
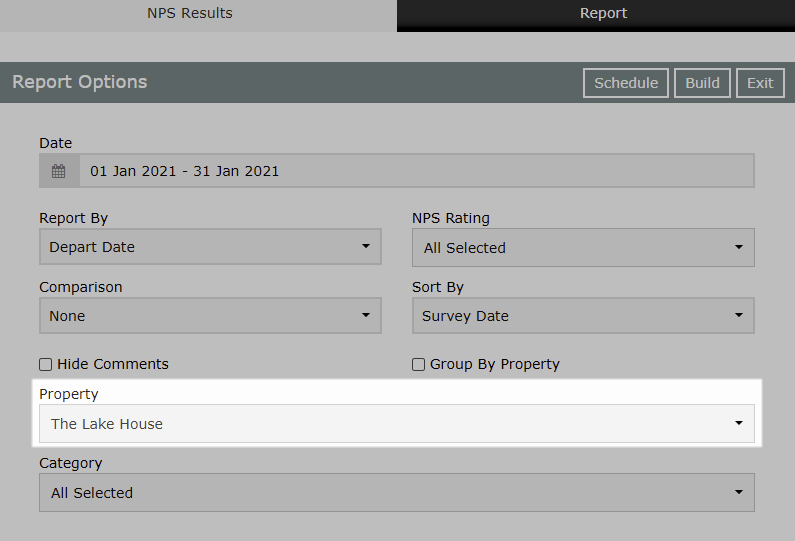
- Select the Property.
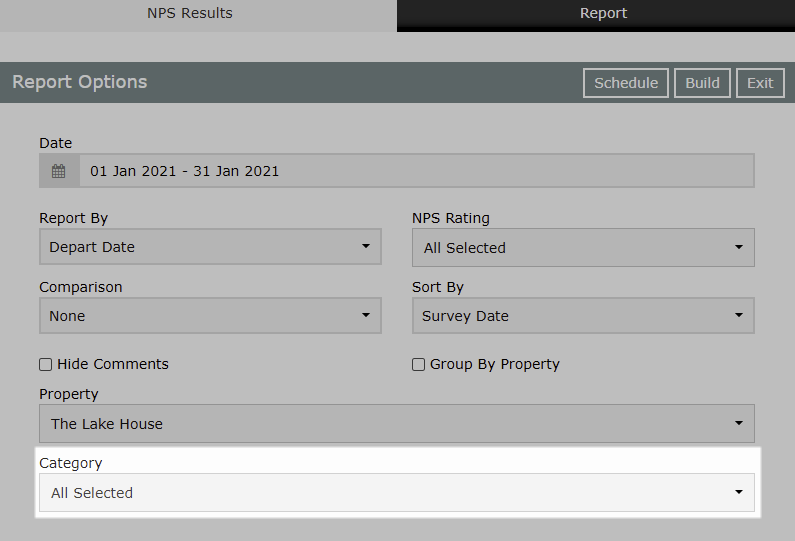
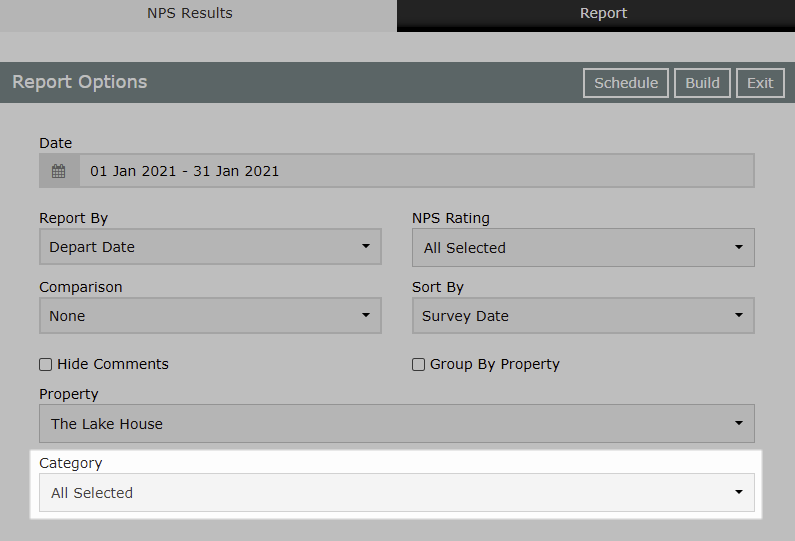
- Select the Categories.
- Build.
-
Guide
- Add Button
Guide
Go to Reports > Management > Guests > NPS Results in RMS.

Select the Date Range.

Select the Report By.
Optional: Select the checkbox 'Hide Comments'.
Select the Property.
Select the Categories.
Select 'Build' to generate the report.
The NPS Results Report includes the overall Net Promoter Score for the selected property as well as the individual scores for each metric, total responses received and the response rate in addition to the individual surveys for the selected date range.
Use
- Go to Reports > Management > Guests > NPS Results in RMS.
- Select the Date Range.
- Select the Report By.
- Optional: Select the checkbox 'Hide Comments'.
- Select the Property.
- Select the Categories.
- Build.
-
Guide
- Add Button
Guide
Go to Reports > Management > Guests > NPS Results in RMS.
Select the Date Range.
Select the Report By.
Optional: Select the checkbox 'Hide Comments'.

Select the Property.
Select the Categories.
Select 'Build' to generate the report.

The NPS Results Report includes the overall Net Promoter Score for the selected property as well as the individual scores for each metric, total responses received and the response rate in addition to the individual surveys for the selected date range.
